Section 5


The Moat: 70% Sole-Source, Content Growing on Every Major Platform
When the Navy needs a quiet valve for a Virginia-class submarine, there is no bidding process. Two things make this permanent:
- Engineering ownership. Sargent Aerospace owns 140+ proprietary valve designs across Virginia and Columbia-class programs. The specification lives in their manufacturing process, not on a transferable drawing.
- SUBSAFE certification. Every component touching a submarine pressure hull requires the Navy’s mandatory safety qualification. Replacing a certified vendor takes years. No program manager accepts that risk.
My contract database confirms it: zero competitive bids across every submarine valve award in 21 years.
This lock-in applies across 70% of RBC’s revenue. Once a component is qualified into a platform, every unit off the line carries that content for the life of the program. And the content grows: 787 from $400K to $600K per aircraft, Virginia-class from $11.5M to $20M+ per 10-ship block.
Content Gains by Platform
| Platform | Content at Launch | Content Today | Change |
|---|---|---|---|
| Boeing 737 MAX | $120,000/aircraft | $200,000/aircraft | +67% |
| Boeing 787 | $400,000/aircraft | $600,000/aircraft | +50% |
| Airbus A320neo | Baseline | +20% incremental | Awarded Q3 FY26 |
| Airbus A350 | ~$125,000/aircraft | ~$255,000/aircraft | ~2x |
| Virginia-class submarine | $11.5M/10-ship block | $20M+/10-ship block | +74% |
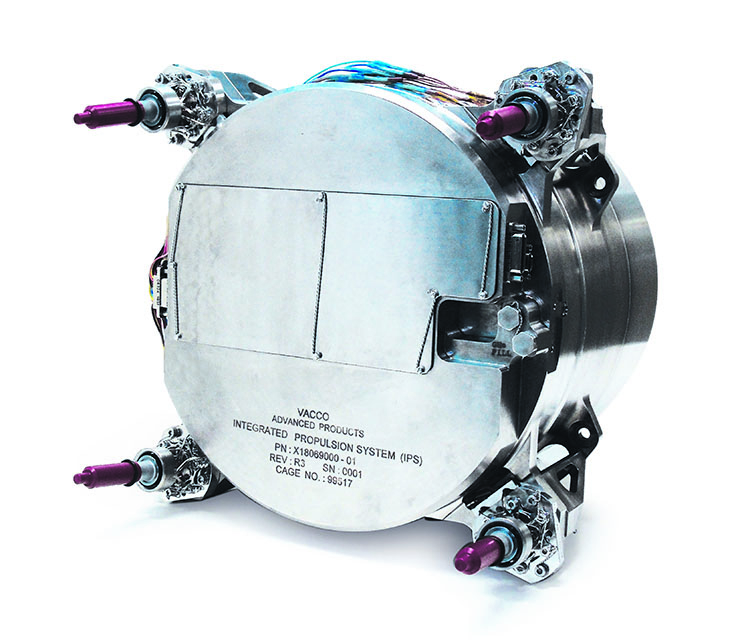
VACCO Industries (acquired July 2025, $275M): Ultra-quiet fluid control systems for nuclear submarines. More than doubled RBC's submarine revenue exposure to over $100M per year.
Product Portfolio: Aerospace & Submarine Systems
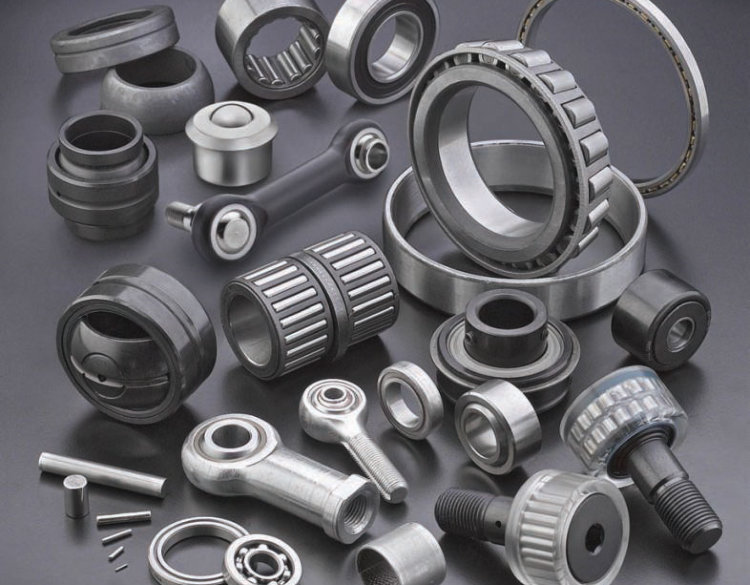
Aerospace Bearings
Industrial Bearings
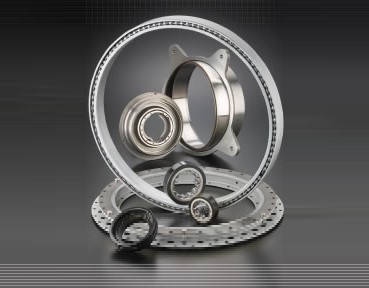
Thin Section Ball Bearings
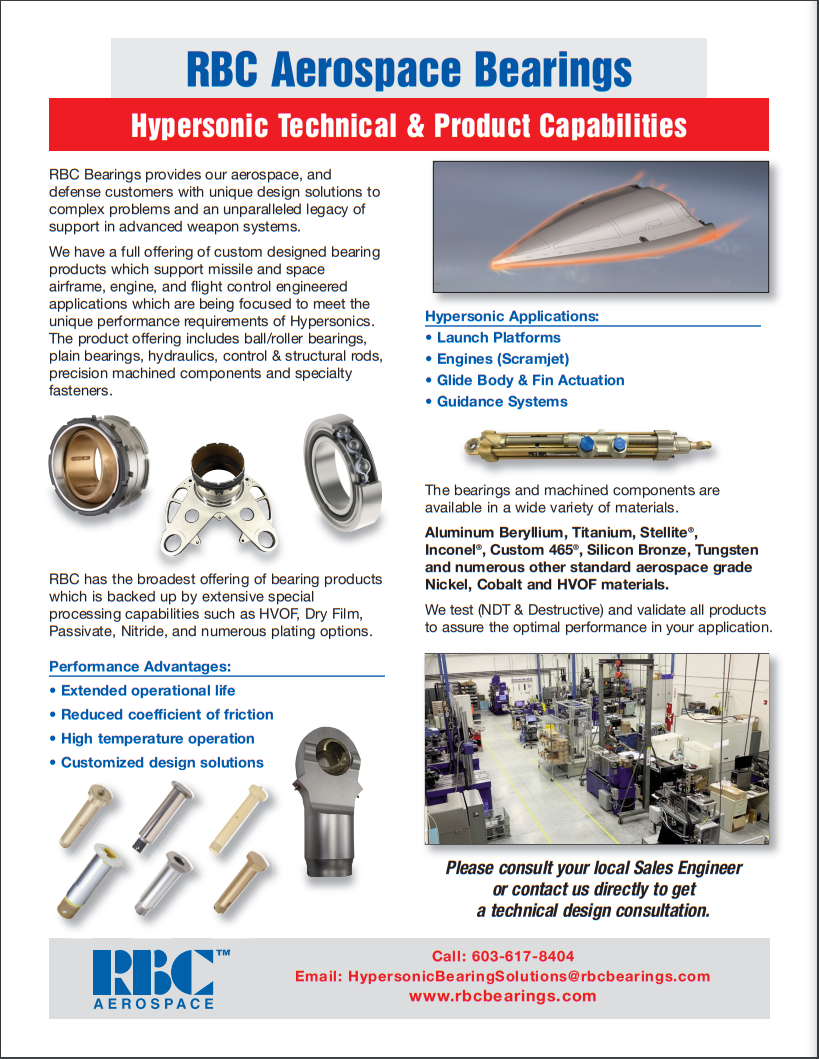
Hypersonic Capabilities
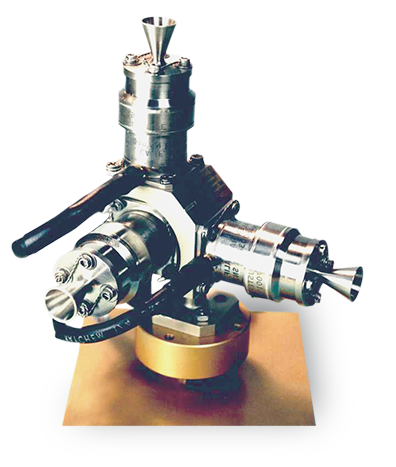
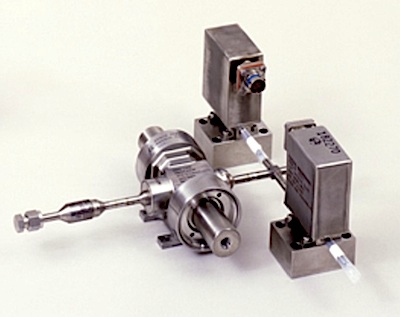
VACCO Thruster Valves
VACCO Launch Vehicle Controls
VACCO Pressure Reg Module
CubeSat Propulsion System